
The first time I opened Unreal Engine's Blueprint editor, sometime around 2014 on a project I never finished, I lost the rest of the afternoon to it. I wasn't there to ship a game. I was a .NET developer poking around a C++ engine out of curiosity, trying to figure out why a graph of nodes and wires felt so much closer to how I actually think about software than the C# I'd been writing all day.
The pattern is obvious in hindsight. Nodes for things. Wires for relationships. Types as a first-class visual concern. You can see the system. You don't have to compile it in your head from sequential text.
For most of the last decade I've looked at the things we build and thought the same thing about most of them: this is graph-shaped. DI graphs, message handlers, EF mappings, workflow definitions, infra topologies. We're just writing them out as prose because our editors only know how to render prose.
I've tried sneaking graph editors into a couple of internal tools over the years. None of them stuck, because they were always after-the-fact visualizations. The code was still the source of truth and the diagram was a generated artifact that lied within minutes of being generated. Blueprints are different. The graph is the source of truth. That's the whole point.
When I started designing the data layer for Golden Reports, I had two requirements pulling in opposite directions. Non-developers (the people configuring a workspace, building reports) need to define what data is queryable. Developers, meaning me and eventually plugin authors, need that definition to compile down to a real, typed GraphQL schema with proper relationships and cardinality. Pick the wrong abstraction and one of those audiences gets screwed.
The path of least resistance was YAML. A data-context.yaml file with entities: and relationships: and a JSON schema for validation. I drafted one. The relationship section looked something like this:
relationships:
  - source: Employee
    sourceField: department_id
    target: Department
    targetField: id
    cardinality: many-to-one
  - source: TimeOffRequest
    sourceField: employee_id
    target: Employee
    targetField: id
    cardinality: many-to-one
It was fine. It was also exactly the kind of code-as-prose problem Blueprints fixed more than a decade ago. Try picturing a multi-table join across an HR schema by reading that and tell me you wouldn't rather see it.
So I built it as a graph editor.
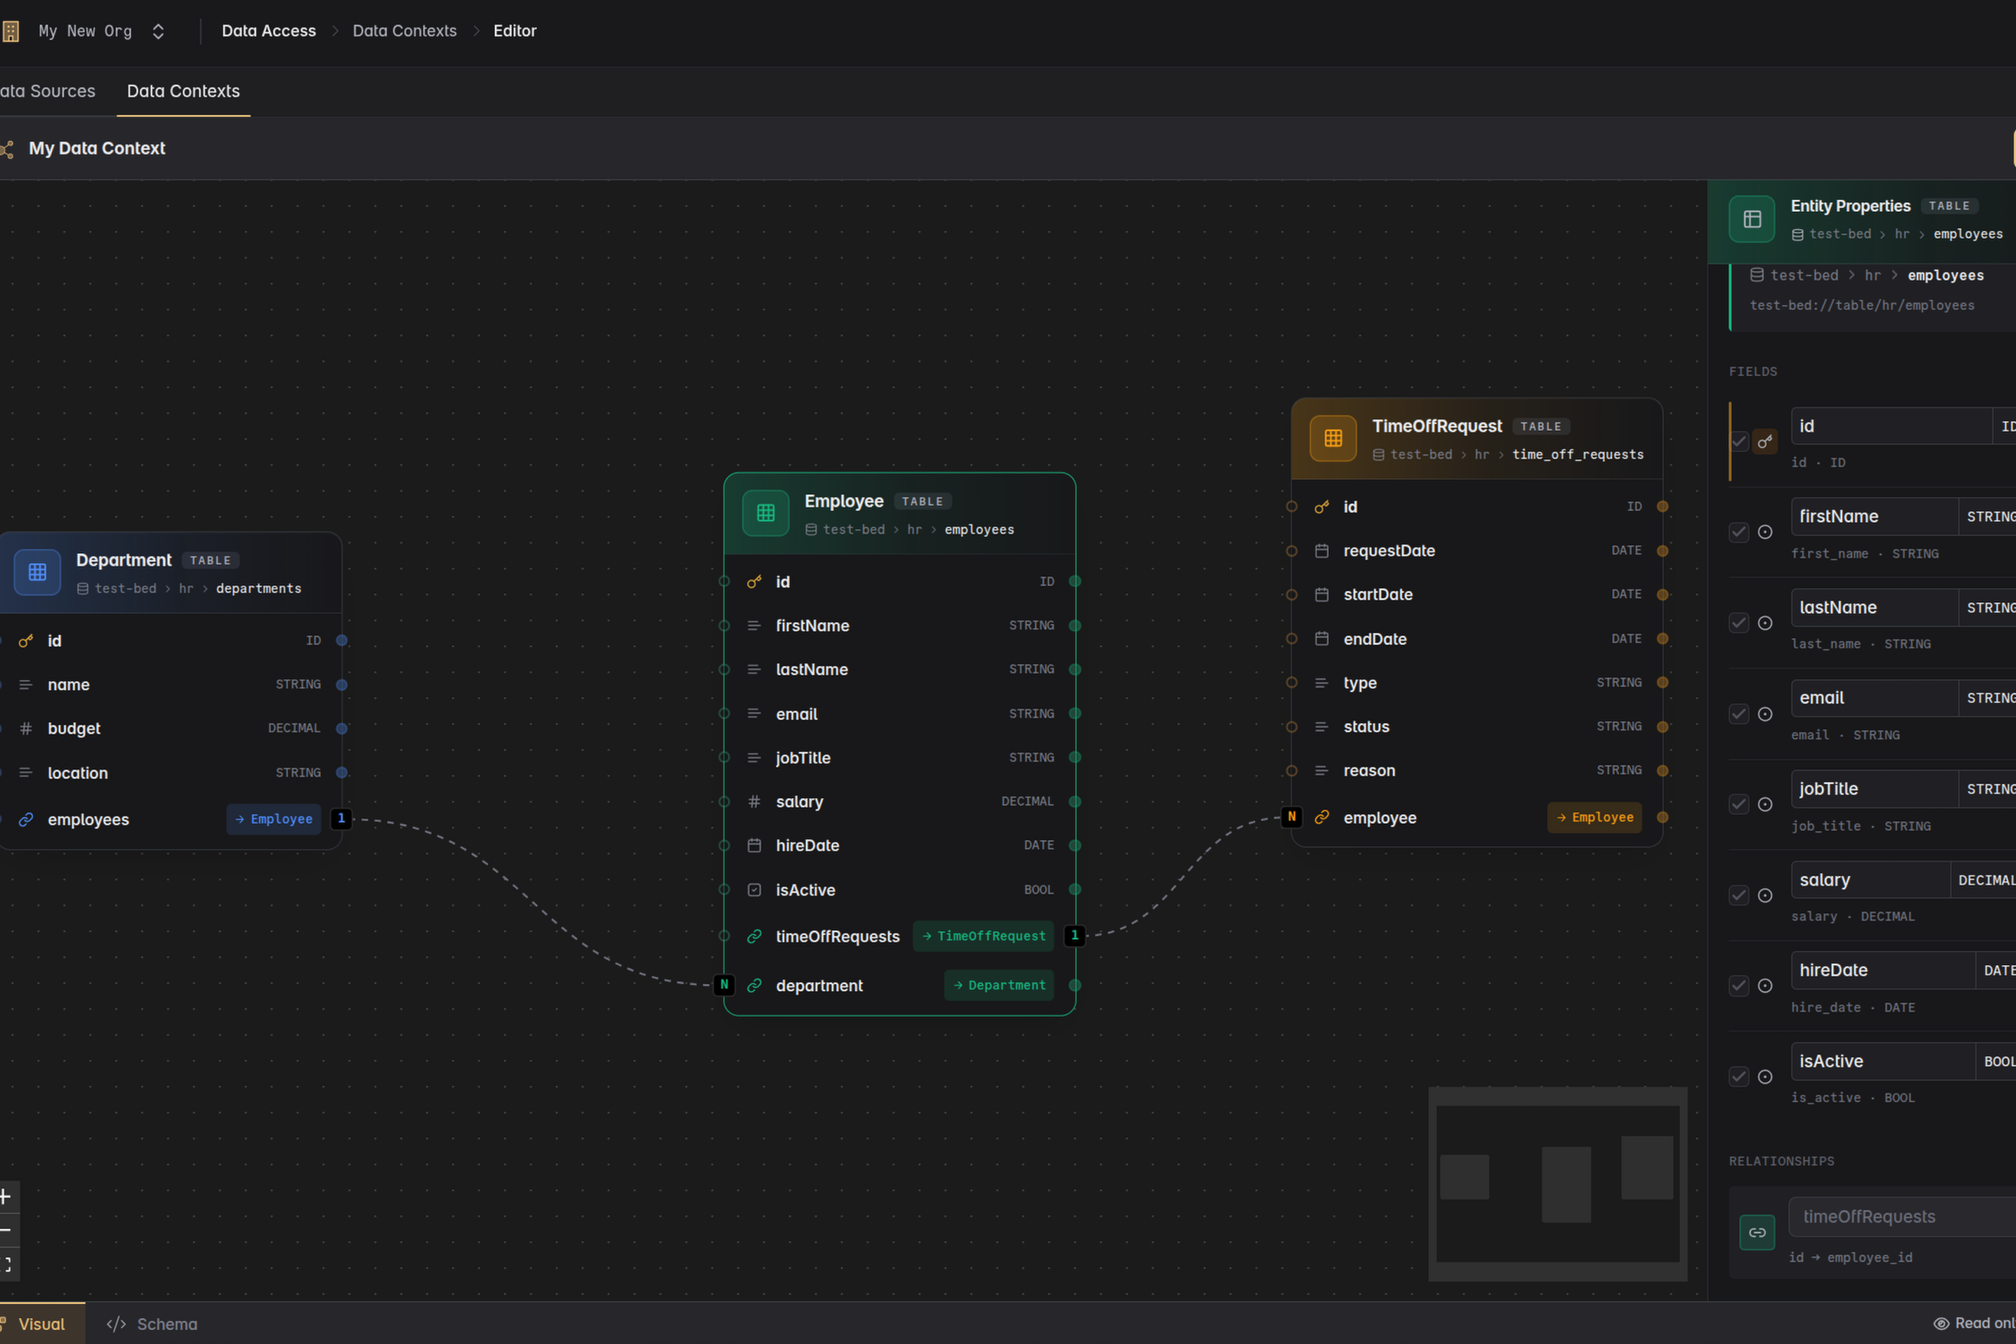
That's what the screenshot above is. Tables are nodes. Fields are pins, with type icons next to each one: ID, string, decimal, date, bool. Relationships are wires, and the cardinality (1:1 or 1:N) lives on the connection itself, not in some metadata block you have to scroll to find. Click a wire and the relationship properties show up on the right, never a modal dialog. Move nodes wherever helps you think; spatial layout has no semantic meaning. All directly cribbed from Blueprint.
A note before I oversell the visual side. There's a Schema tab sitting right next to the Visual tab at the bottom of the editor (you can spot it in the screenshot). For the MVP, that tab is read-only. You can see the generated schema, but the graph is the source of truth. Two-way sync, where you can edit on either side and both stay in lockstep, is on the roadmap for the release after this one. It's the kind of feature that's easy to underspec and hard to get right, and the MVP didn't need it to deliver value.
It's the same principle I use with git, just inverted for now. With git, every commit, rebase, and branch I do goes through the CLI; I almost never touch a GUI to make a change. But every so often I'll open a visual history tool just to see the broader shape of the repo: where branches diverged, what merged into what, the overall structure. The visual is the lens, the CLI is the source of truth. In the Data Context editor MVP it's the other way around. The graph is where you make changes, the schema view is the read-only lens. Once two-way sync ships, both sides become first-class editors of the same model. Schema-first engineers can live in text (plenty will, including me on certain days), non-engineers can live in the graph, and anyone can flip to the other view to sanity-check their work.
What this buys me beyond "looks nice":
- The visual graph compiles to a typed GraphQL schema, the same way Blueprint nodes compile to bytecode. The graph is the schema.
- A non-engineer can extend the data context without writing code, but the output is still validated, versioned, and properly typed.
- The model is debuggable by inspection. You don't have to run a query to know what's joinable to what.
The Schema tab at the bottom of the editor shows the actual GraphQL types the graph compiles to. For the screenshot above, that output looks roughly like:
type Employee {
  id: ID!
  firstName: String!
  lastName: String!
  email: String!
  jobTitle: String!
  salary: Decimal!
  hireDate: Date!
  isActive: Boolean!
  department: Department!
}

type Department {
  id: ID!
  name: String!
  budget: Decimal!
  location: String!
  employees: [Employee!]!
}
That's what every report query downstream is typed against. The visual graph and the schema are the same artifact, viewed two ways.
Not everything from Unreal made it across. Here's roughly what I borrowed and what I deliberately left out:
| Blueprint concept | Data Context Editor | Reasoning |
|---|---|---|
| Typed pins | Typed fields with type icons | Same job: signal what connects to what |
| Wires between pins | Wires between fields | Same job: express relationships |
| Right-side details panel | Right-side properties panel | Contextual editing without modal dialogs |
| Free-form spatial layout | Same | Layout helps the human, not the compiler |
| Execution wires | (excluded) | A schema isn't a program |
| Macros and function nodes | (excluded) | The data context is declarative |
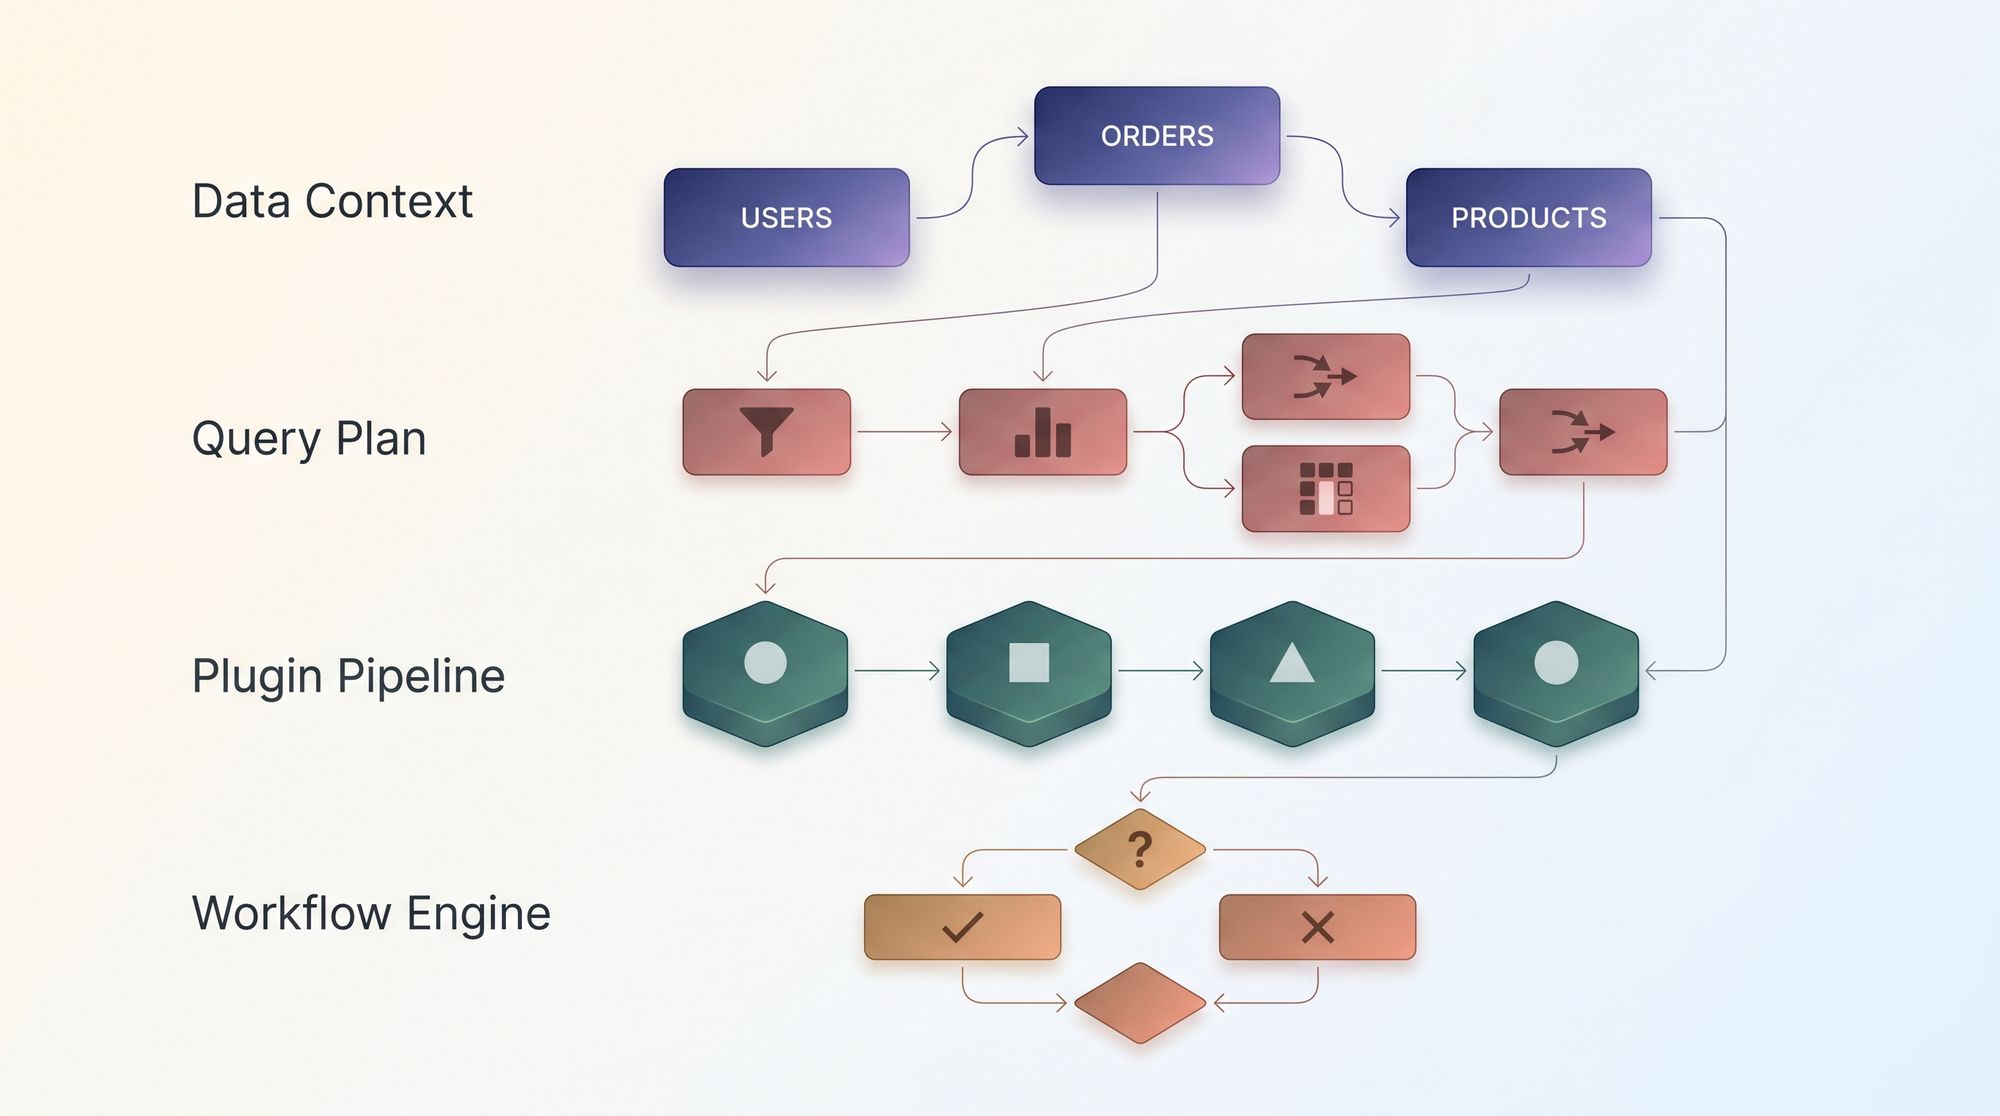
The execution-flow graph in Golden Reports lives at a different layer (the query plan), for a different audience (the query engine), and conflating it with the schema would have been a mess.
The hardest part wasn't actually building the editor. It was convincing myself this was the right place to spend the effort. The MVP could have been YAML and probably would have shipped a month earlier. But the data context is the surface where business users meet engineers, and that's exactly the kind of seam that justifies a visual representation. If I cheaped out there, every report builder above it suffers.
There are more graphs coming. The query engine has its own (query plans, transformer pipelines). The plugin/connector system will have a third. At some point I suspect most of Wolfware will be graphs editing graphs, with Rust and .NET doing the actual work underneath. I'm pretty okay with that.
If you build developer tools and you've been quietly waiting for an excuse to put a Blueprint-style editor in your product: stop waiting. The pattern works far outside game engines. Most of what we do is graph-shaped. We just keep writing it out as text.
