
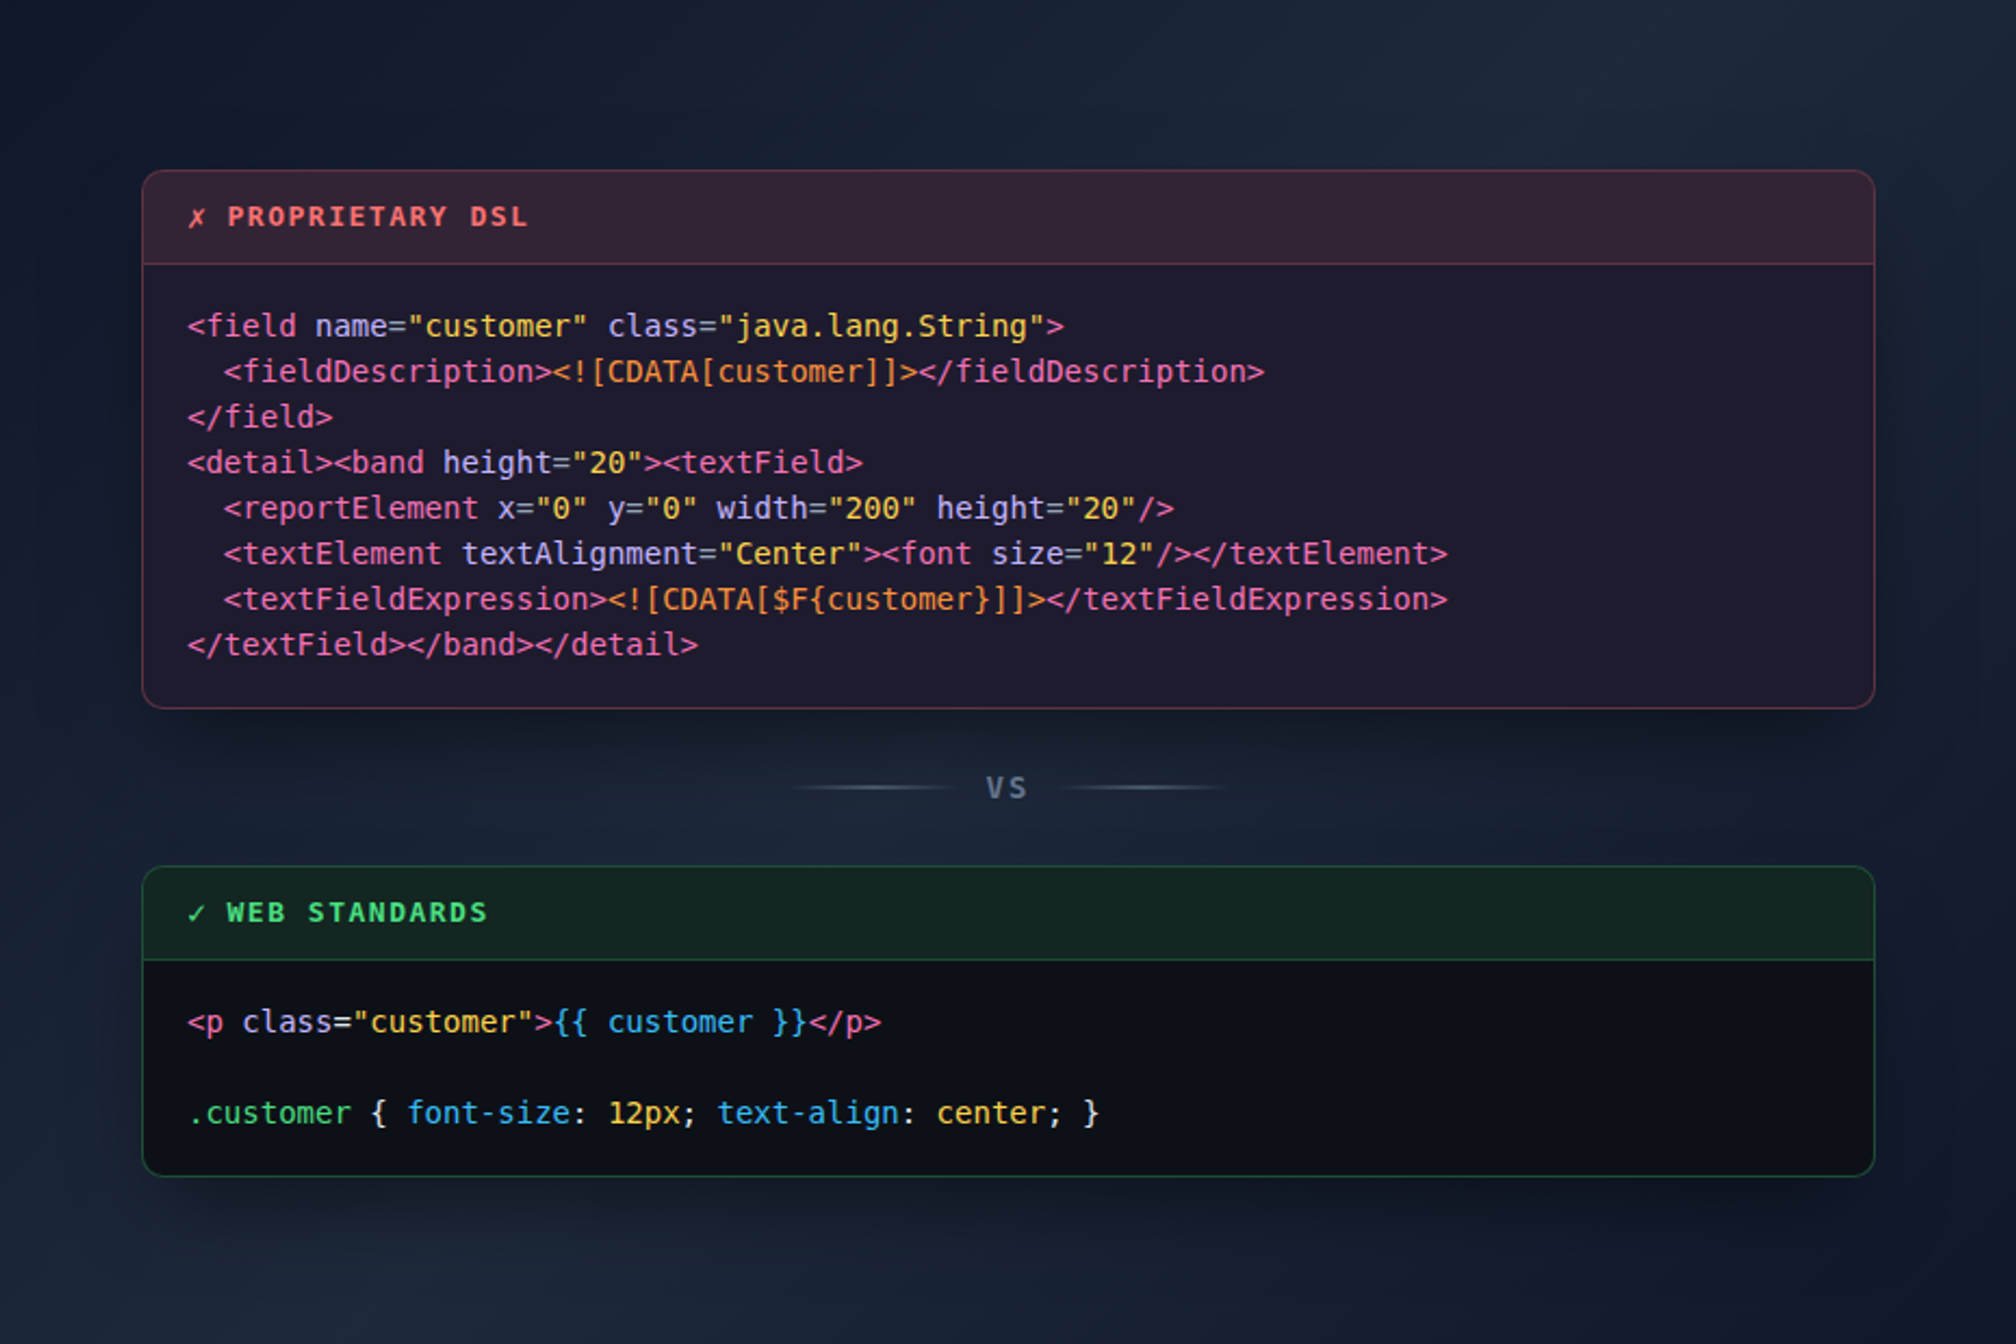
Every reporting tool invents its own language. Jasper has JRXML. Crystal has RPT. SSRS has RDL. Each one different, each one proprietary, each one a skill that doesn't transfer anywhere else.
We didn't want to add another one to the pile.
The DSL Trap
Report definition languages made sense in 2005. Browsers couldn't handle print layout. If you needed pixel-perfect positioning, page breaks, or repeating headers, you needed specialized tooling. So every vendor built their own XML dialect, their own expression syntax, their own rendering engine.
The result? Developers learning whatever obscure format their company picked. Debugging by staring at XML. Copy-pasting from Stack Overflow posts from 2012. Fun.
Here's a typical Jasper expression for a simple null check:
<textFieldExpression><![CDATA[$F{customer_name} != null ? $F{customer_name} : "N/A"]]></textFieldExpression>XML with CDATA wrappers, inside an expression language that looks like Java but isn't quite. There's a better way.
What Changed
Modern CSS can do things that would've seemed like magic in 2005. @page rules define page size, margins, headers, and footers. @media print styles only apply when printing. break-before and break-after give you explicit page break control. Flexbox and Grid actually work. CSS variables let you theme dynamically without a build step.
Browsers became real print engines. Chrome's print-to-PDF actually works now. So why are we still writing XML?
The Golden Reports Approach
We made three technology choices that go against industry convention:
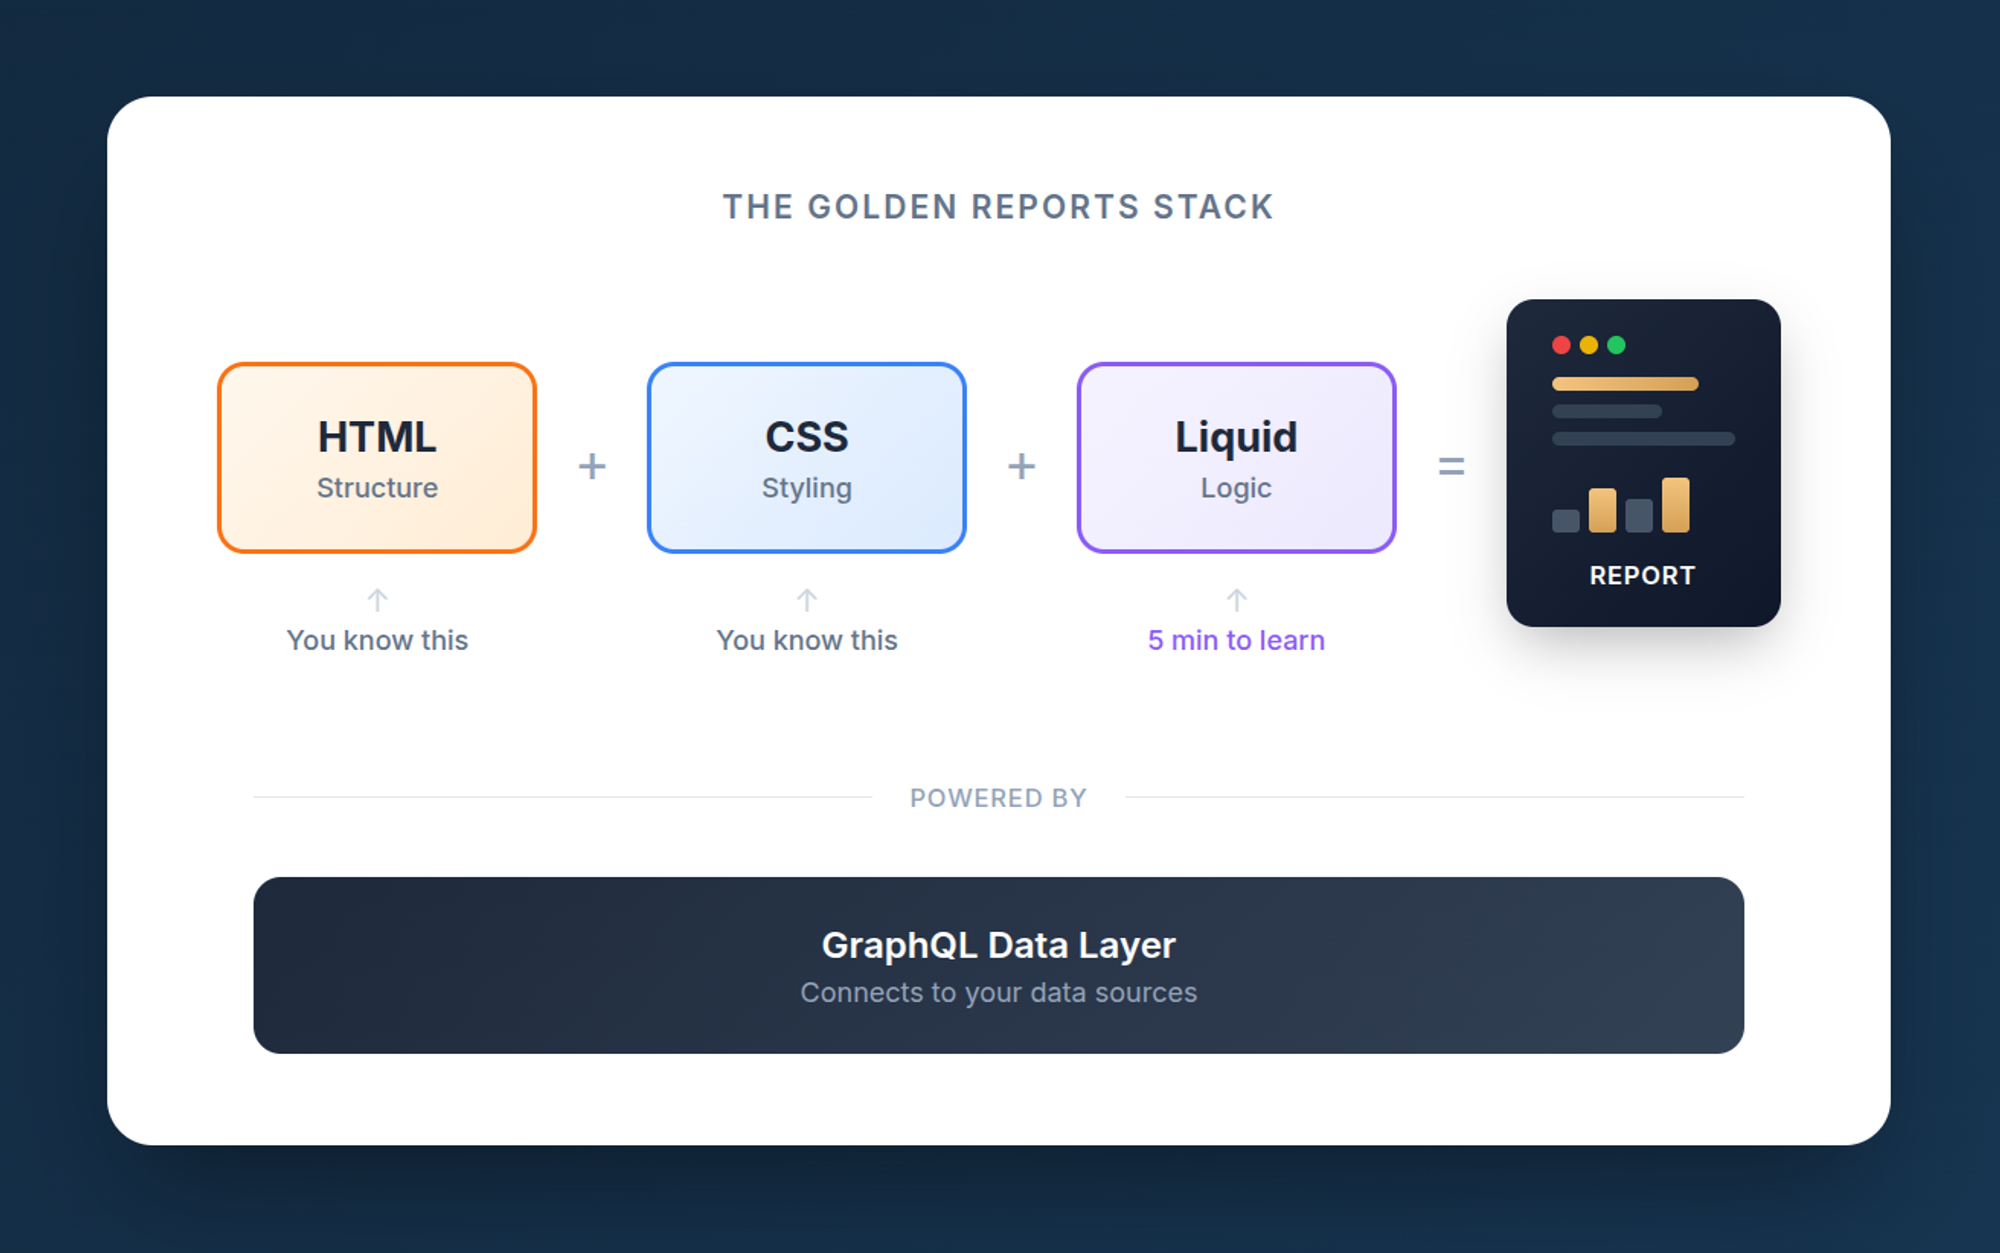
HTML+CSS for Layout
Your reports are just web pages. Style them with CSS you already know. Debug them with Chrome DevTools. View source and actually understand what you're looking at.
<div class="invoice-header">
  <h1>Invoice #{{ invoice.number }}</h1>
  <p class="date">{{ invoice.date | date: "%B %d, %Y" }}</p>
</div>
We also ship built-in blocks as plugins. KPI cards, data tables, charts. all as reusable components. Under the hood, they're Web Components. Another web standard. In code view, they look like custom HTML elements. In visual view, they're just blocks you drag onto the canvas. Golden Reports loads them dynamically, so you only ship what you use.
Liquid for Templating
We needed a templating language. We could've invented one. every other reporting tool did. Instead, we picked Liquid.
Liquid is boring. It's been around since 2006. Shopify uses it. Jekyll uses it. It has loops, conditionals, filters, and nothing fancy. The documentation fits in your head.
{% for item in order.items %}
  <tr>
    <td>{{ item.name }}</td>
    <td>{{ item.quantity }}</td>
    <td>{{ item.price | money }}</td>
  </tr>
{% endfor %}
No learning curve. If you've used any templating language, you already know 90% of Liquid.
If you've used Angular or Vue, the syntax will feel instantly familiar. {{ invoice.total | currency }} uses the same pipe syntax as Angular. filters that transform values inline. Loops use {% for item in items %}, similar to Angular's @for or Vue's v-for. Your frontend instincts transfer directly.
GraphQL for Data
Reports need data. Instead of inventing a query language or forcing you into our ORM, we use GraphQL. You define your data context. a schema that describes what data is available. Your report queries that schema. The Golden Reports engine resolves the query against your actual data sources.
query InvoiceData($invoiceId: ID!) {
  invoice(id: $invoiceId) {
    number
    date
    customer { name, email }
    items { name, quantity, price }
    total
  }
}
Typed. Composable. Familiar to any developer who's touched a modern API.
What You Actually Gain
This isn't philosophy. It's practical:
- Your tools just work: VS Code, Prettier, ESLint, browser DevTools. No proprietary IDE required.
- Your team knows it already: HTML and CSS are universal. Zero training, zero ramp-up.
- The ecosystem is massive: CSS print media queries, Liquid filters, GraphQL tooling. Decades of solutions.
- You're not locked in: HTML is portable. Your templates work outside Golden Reports.
Side-by-Side Comparison
| Feature | Proprietary DSL | Web Standards |
|---|---|---|
| Learning Curve | Weeks to months | Already know it |
| Tooling | Vendor IDE only | VS Code, any editor |
| Debugging | Cryptic errors | Browser DevTools |
| Styling | Limited presets | Full CSS power |
| Portability | Vendor lock-in | Works anywhere |
| Hiring | Train from scratch | Every web dev |
Two Views, One Source
Here's the thing: you don't have to choose between visual and code. Golden Reports has both.
The editor has two views. Visual view gives you classic drag-and-drop. add sections, arrange blocks, style with panels. Code view shows you the HTML+CSS+Liquid underneath. Switch between them anytime. They're the same document.
We also ship built-in blocks as plugins. Drop in a KPI card, a data table, a chart. all as reusable components. In code view, they look like custom HTML elements. In visual view, they're just blocks you drag onto the canvas.
The difference from other tools? The visual editor isn't hiding a proprietary format. It's editing real HTML. When you need to do something the visual editor can't handle, you switch to code view and fix it yourself. Then switch back.
Who This Is For
This is for teams that got burned by "simple" tools. You know the ones easy until you hit a wall, then impossible.
The escape hatch is always there. That's the point.
Golden Reports launches Early Access in May 2026. Join the waitlist at goldenreports.dev for 50% off your first year.
